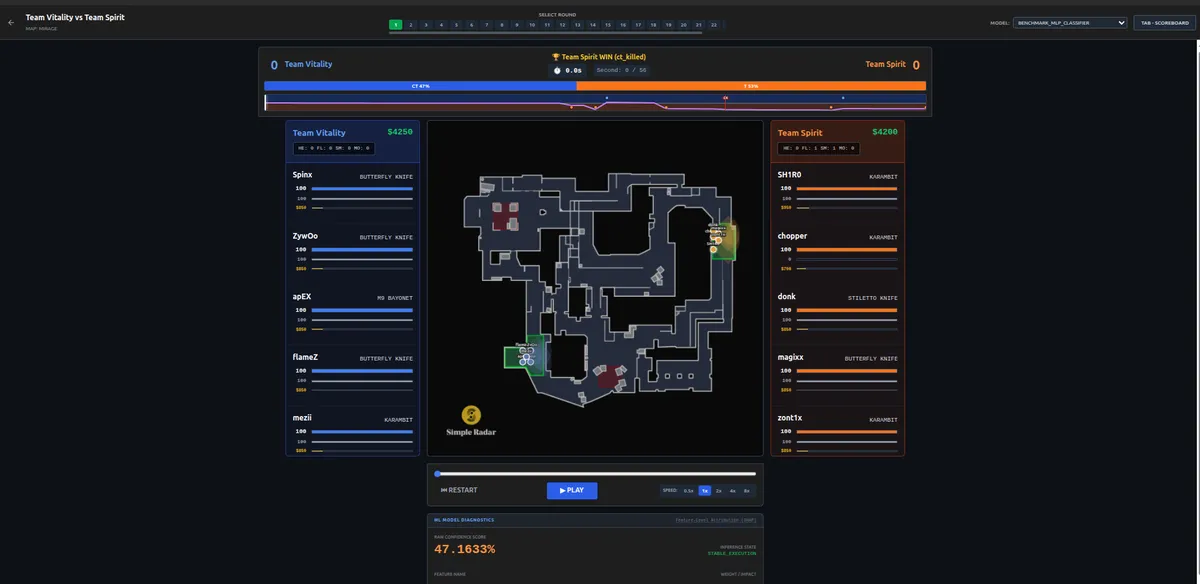
A model that gives the probability of winning a round, second by second. I downloaded professional match recordings with Selenium, parsed them with demoparser2 and built the features in pandas: 9,196 maps, 187,361 rounds and 16.8 million game states.
I compared nine models, validated by match groups and walk-forward by quarter, with bootstrap tests, ablations, calibration and SHAP. Gradient boosting came out best: LightGBM log loss 0.527, ROC-AUC about 0.81–0.82 in the quarterly walk-forward tests, and an expected calibration error (ECE) of 0.0086 for the production XGBoost model. Predictions are served by FastAPI to a React app.
| Model | Log loss | ROC-AUC | Brier |
|---|---|---|---|
| LightGBM | 0.5267 | 0.8036 | 0.1790 |
| CatBoost | 0.5272 | 0.8059 | 0.1786 |
| XGBoost (production) | 0.5289 | 0.8017 | 0.1800 |
| Random forest | 0.5295 | 0.8035 | 0.1797 |
| MLP | 0.5323 | 0.8016 | 0.1807 |
| Extra trees | 0.5332 | 0.8043 | 0.1805 |
| Logistic regression | 0.5518 | 0.7918 | 0.1858 |
| Linear regression baseline | 0.5919 | 0.7889 | 0.1891 |
| Ridge classifier | 0.6044 | 0.7889 | 0.2074 |
| Test quarter | Training maps | Logistic AUC | XGBoost AUC |
|---|---|---|---|
| 2024 Q1 | 844 | 0.7302 | 0.6498 |
| 2024 Q2 | 1,448 | 0.7973 | 0.8049 |
| 2024 Q3 | 3,519 | 0.8005 | 0.8140 |
| 2024 Q4 | 5,315 | 0.8032 | 0.8183 |
| 2025 Q1 | 5,999 | 0.8051 | 0.8217 |
| 2025 Q2 | 6,457 | 0.8038 | 0.8190 |
| 2025 Q3 | 7,172 | 0.7980 | 0.8119 |
| 2025 Q4 | 7,828 | 0.8016 | 0.8142 |
| 2026 Q1 | 8,770 | 0.7956 | 0.8094 |